SQL SERVER ANALYSIS SERVICE GIVE US ANALYTICAL FREEDOM
- Admin

- Jan 23, 2018
- 4 min read
One of the most dynamic technology from MSBI Stack is SQL Server Analysis Services (SSAS). It is a powerful analytical tool for upper management to make right and appropriate business decision.We can create multidimensional or tabular model Cube using the Existing Data warehouse or Datamart for sharp analysis for the business decision. This article help to get a primary idea about SQL Server analysis service for those who don't have any experience with this tool.
When we look at a picture we can see only two surface that is two dimensional but thinks about a CUBE .we can see multiple surfaces. SQL Server Analysis service creates a report as the multi-dimensional report.We call this Cube.
Let's say, When we look at a report and see the total call handled for January 2017 then we are looking into a two-dimensional report but if we want to see at the same time
Total Call handled
By Month
By year
By date
By Manager
By Team Leader
By Agent
By location
And so on in one report that is the Multidimensional report. I would like to explain with an example how dynamic analytical tool is SSAS Cube as a Multidimensional report.
In SSAS Cube deals with Facts and Dimensions. The measure, in fact, is a value of any kind of business process (e.g Total calls handled). When we asked the measure by which then it is the dimension (e.g Calls handled by the agent or by date, here agent or date is dimension). Below example based on a scenario where we have to analyze different type of factor by multiple dimension like
ACW(After call work) time, Number of calls handled, Handle time, Hold time etc. by year, by Month, by date, By manager, By Team lead, and by Agent
Adherence by year, by Month, by date, By manager, By Team lead, and by Agent
Member auto-renew, average AR by year, by Month, by date, By manager, By Team lead, and by Agent
Quality score, evaluation by year, by Month, by date, By manager, By Team lead, and by Agent
In this example, we can see how easy and dynamically an SSAS Cube can be analyzed only by dragging and dropping the fact measure and dimensions.
Below screenshot a cube that already created and deployed to the SSAS server where users need to drag and drop the measure and dimension for analysis

Now we would like to analyze the facts (ACW Time, Avg ACW, Call handled, Handle time, Adherence, Quality score, Evaluation. We drag and drop this Measures and also drop some dimensions.
Here we dragged all the measure that we need to analyze and drag only one dimension and that is Manager name. This facts value is a summarized value of the beginning of the business or from when the business started to keep the record in a database.(This value is sample data coming from local Data warehouse created on the local machine).

If we want to see the value for all manager from 2017-11-01 to 2017-11-20.
Drag and drop Date hierarchy in the filter space. We want to give the date range so we choose inclusive option and select to date in between.(2017-11-01 to 2017-11-20)

Now we can see the value of given date range (2017-11-01 to 2017-11-20)

If we would like to compare value between only the November month value for each year
Drag Month name in the filter area and select the month

Now we can compare the value for November for every year.(Note: in my sample Data warehouse has only 2016 and 2017 data that's why other year came as Null.
If we want to see all year month and date value together then we do not need any filter only need to drag the date hierarchy to the work space

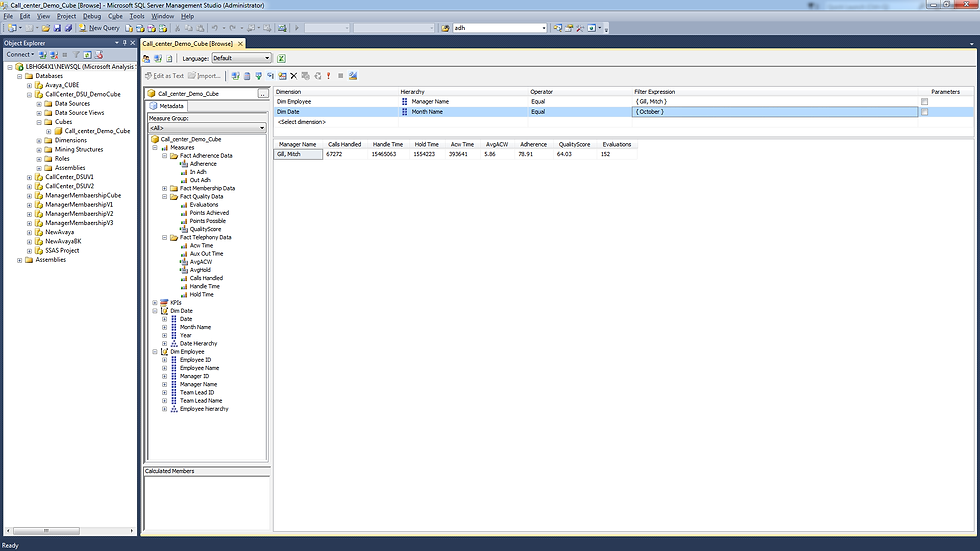
Same way if we want to see any manager performance only filter employee hierarchy on the filter and select expected manager name

Above value is entire business time value for this manager.Let's see value for the specific year, month and date for this manager.Drag and drop Date hierarchy to the filter space and select the month

By dragging the date attribute we can see by the date for this manager

Let's say we want to see the specific manager underneath team leader and again with this date range.Only drag the Employee hierarchy on the work space

Even if we want to see individual agent value we need only to drag the employee name attribute on the filter
We can see only the agent (Abel Paul) with his team lead and Manager.

If we are already familiar with Power Pivot in excel then it would be easy for then by export this SSAS Cube as Excel .Let’s see how it possible
Click on the excel button

It will give us below power pivot page with all measure and dimension table

Now we can analysis in our own way that we do in excel

SQL Server Analysis service gives the freedom of analysis for the users who can analysis everything as they required. Now it may be a little difficult to get all this but when we able to get in the SSAS Server and play with it we can see how easy, powerful and dynamic analytical tool it is.


Comments